Find your bottleneck.
AI shows the fix.
An AI analyst for the one thing that decides how fast any process runs: its slowest step. Describe your line in plain English or punch in the figures — the AI finds the bottleneck, predicts the throughput, and tells you exactly where to add capacity. Grounded in the real operations math — Little’s Law, OEE, process cycle efficiency — and explained like a colleague would.
Four models. One AI read of your slowest step.
Pick a model, change the numbers, and the AI reads the result live — what it means and where to act. Every figure is computed in your browser, then interpreted for you the moment it moves.
Four models your AI reads at once.
No login, no upload, no spreadsheet. The AI runs the operations math your team reaches for and hands back the answer with the reasoning — side by side.
Throughput & Little’s Law
The AI relates work-in-progress, cycle time and throughput — change any two and it reads the third, the law every queue obeys.
Throughput = WIP ÷ Cycle timeBottleneck finder
Enter the capacity of each station and the demand. The AI finds the constraint, caps the line’s throughput, and flags exactly where to add capacity.
Throughput = min(station capacity)OEE
The AI turns availability, performance and quality into one honest number for how hard your equipment is really working — and names the weakest link.
OEE = A × P × QProcess Cycle Efficiency
See how much of your lead time actually adds value — and how much is just waiting in a queue. The AI reads the gap as your opportunity.
PCE = Value-added ÷ Lead timeThe constraint, explained by AI — not buried in a grid.
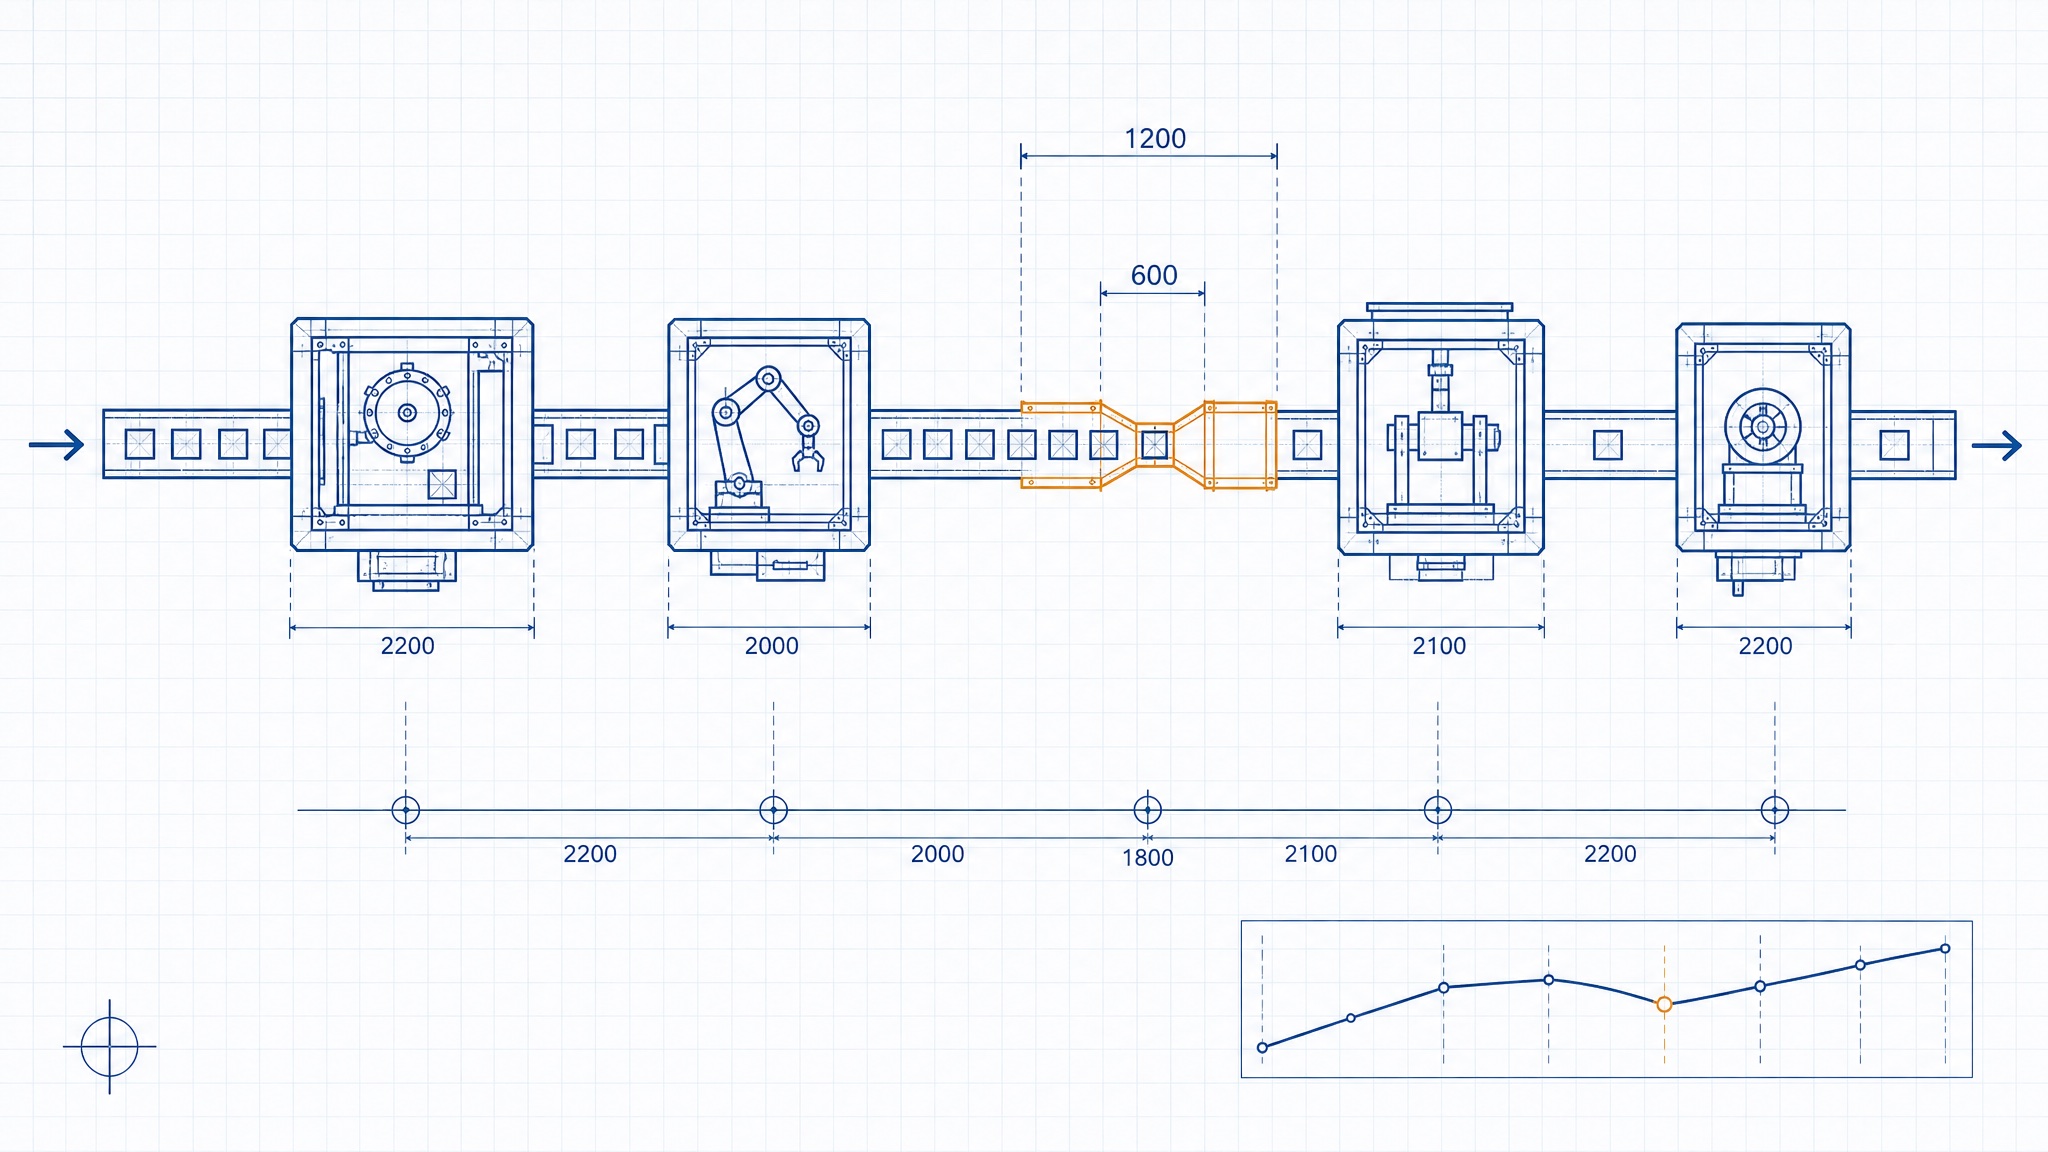
The AI shows the same thing the best operators carry in their heads: where the line slows down and by how much. It lays out capacity station by station, flags the bottleneck, reads utilisation per step, and writes the one recommendation that moves the line — so you spend your effort on the step that actually matters.
Open the AI analyst →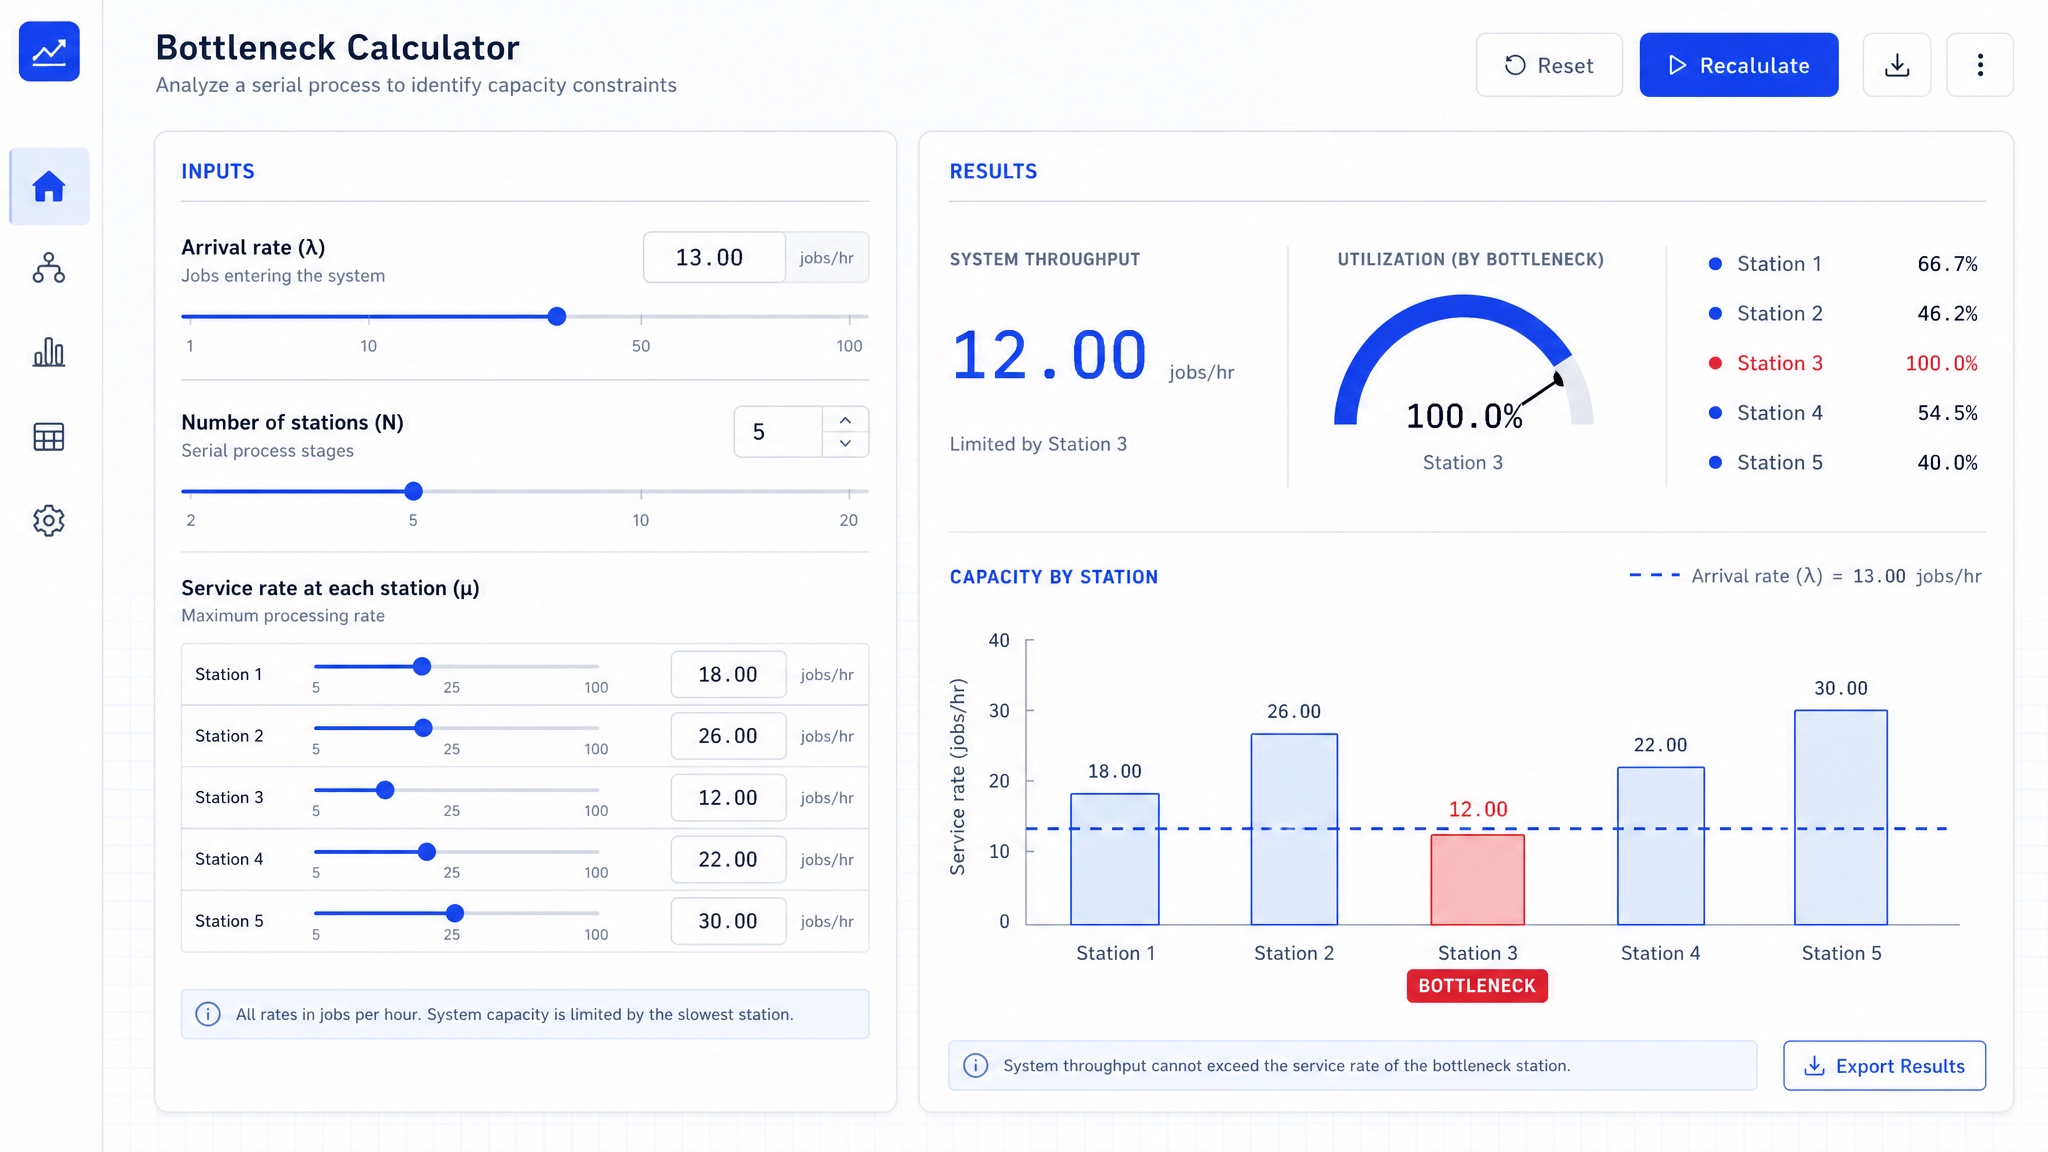
Three steps to a number you can act on.
Pick a model or describe your process
Throughput, the bottleneck finder, OEE or cycle efficiency — each maps to a question operations teams ask every week, and the AI knows which math to run.
Enter the numbers
Use the fields or the sliders. Everything computes live in your browser — nothing is uploaded, nothing is stored, nothing to install.
Get the AI’s verdict and next move
You get the figure, the gauge or the flagged constraint, and a plain-English read of what it means and exactly where to act.
The AI analyst is free. Forever.
Every model and every AI read is free, no account, no limits. Upgrade only if you want to embed it, drop the ads, or save your scenarios.
Free
For everyone
- All four AI models
- Unlimited analysis
- No account needed
- Runs in your browser
Pro
For regular users
- Everything in Free
- No ads
- Save & name scenarios
- Export to CSV & PDF
- Multi-stage line builder
Embed
For teams & sites
- Everything in Pro
- Embed the AI analyst on your site
- White-label & API
- Priority support
The AI analyst is and will stay free to use. Paid tiers only add embedding, saving and convenience.
Common questions.
What is a bottleneck, exactly?
The bottleneck is the slowest step in a process — the one station, machine or stage whose capacity caps the throughput of everything else. Improving any other step does nothing for the whole line until you relieve the constraint, which is exactly why the AI hunts for it first. The Theory of Constraints is built on this single idea.
How is this “AI” and not just a calculator?
Under the hood are the exact, trustworthy formulas — Little’s Law, OEE, PCE. The AI layer is what reads those results the moment they change: it finds the constraint across your stations, decides which input is dragging the number down, and writes a plain-language verdict and recommendation instead of leaving you a bare figure. You get the math you can trust and the interpretation you’d otherwise ask an analyst for.
Does my data leave my browser?
No. Every figure you type is computed and analysed locally in your browser — nothing is uploaded, nothing is stored, and there is no account. The AI read happens on your device, so your operating numbers stay yours.
How does the AI find my bottleneck?
Enter the capacity of each station and your demand. The station with the lowest capacity is your constraint, and the line cannot run faster than it — the AI flags it, caps the throughput accordingly, reads each station’s utilisation, and tells you precisely where adding capacity will pay off.
What counts as a good OEE or PCE?
For OEE, around 85% is considered world-class and 60% a common starting point, so anything well below 60% signals a real loss worth chasing — and the AI names which of availability, performance or quality is to blame. Process Cycle Efficiency is usually much lower: many processes sit under 25%, meaning most of the lead time is waiting rather than adding value.
Stop guessing where the line slows down.
Open the AI analyst, enter your numbers, and read the constraint with its fix — free, in your browser, in about ten seconds.
Open the AI analyst